We are living in the world of graphics where everyone gets attracted towards colored images and captivative visuals, visual representation of your business or ideas is highly important. For example, let’s talk about infographics and visual graphics. You must know Infographics are creative, engaging visual presentations of your ideas, statistics, or research. You can use them to tell the world about your ideas and views in a more attractive way.
Above all, it is not difficult to be a graphic designer expert to design infographics by using unique ideas. Here in this blog, we can help to use software like Canva. It has pre-made infographic templates available. To tell you everything about Infographic Design Inspiration, see our unique and creative infographic ideas you can use to differentiate your brand.
Significance of Infographics in Modern Content Marketing
Now we will discuss the significance of infographics in modern content marketing. As humans, we find visual content highly appealing and prefer it to written content. When we watch a movie instead of reading a book it’s based on our psychology. When we scan documents and stop at an image it’s the real factor that makes the call for us.
Our attraction to visuals plays a big role in content marketing. Visual content such as infographics and animations generate more engagement than plain text content. The power of infographics is that they can increase the effectiveness of your content and make it easier to understand. This article will explore infographics in detail and discuss their benefits, uses, and effects. In short, everything you need to know about why graphics are an essential part of today’s content marketing strategy we will discuss in this article.
90% of information transmitted to our brain is in visual form. In fact, our brain can process visual information 60,000 times faster than text.
So we will see many advantages of infographics.
- Visual communication is more effective and interactive. It also adds a creativity layer bringing a fresh touch to information presentation.
- Infographics summarize the essence and thus provide an information pack that simplifies the process of education and informing.
- Effective infographics break complex concepts into simple and understanding information with the use of visuals and short stories.
- Graphics are more appealing and attractive to the human brain. Because people remember what they see rather than what they read.
- If we discuss the term with a website owner, infographics catch more attraction than simple content. So this helps in getting more traffic on the website.
- Compelling infographics with credible data will drive people to link to your website which will benefit your organic search traffic.
- Images also help to boost website ranking and aware people of your brand.
Guideline on Brainstorming Creative Ideas for Infographic Topics and Themes
Are you curious why no one paying attention to your content or running low on creative energy every time you are about to start on an infographic project?
With all the raw data and information that you have till now, it is time to transform it into highly attractive and surprisingly beautiful graphics. We all know what it feels like when your preferred creative’s well are about to run dry. It makes you clueless about where to tap for your next score of fresh ideas.
Here are a few ideas that will inspire you with graphic design infographic inspiration and help you start work again. After applying these techniques, you will get more engagement in your infographics at the same time because they are customer-centric rather than product-centric.
So let’s see them and see how you can get more engagements and what are the best practices.
- You read daily information relevant to your industry such as newspaper articles blogs and think pieces reports. All this information and reports can make the best infographic ideas for your next infographic practice. You can follow their designs and sometimes you can get information that will be used in your infographics.
- The second point that comes in this line is the pop culture trends. These terms include music entertainment sports fashion and similar things. You can get motivation from them and add their practices to your graphic design formats and designs.
- Making posters and other graphic designs on social issues also gets engagement. Different high-level organizations use this technique and publish social issues in infographic formats.
- Making posters and videos on past stories and politics also gets engagement. It is one of the interesting ways to blend yourself into a meaningful conversation. Monitor headlines that take a look at Google trends to keep your finger on the plus. But remember one thing never talk about hot political issues and some sensitive issues like religion.
- For your infographic site announce some international upcoming events such as any tournament or anything like. That thing gets engagement on television that also can take engagement on your website.
- Either you are working with the content marketing team or using social media. Adding poles in your accounts also gets engagement and attracts people to your account.
These are only a few tips that we are providing you on getting creativity in your graphic designs but you can also make many more posts. Add topics that are on the highlights in television and always check the Google trends and add the same topics. You also can add some funny content that can get leads.
Graphic Design Infographic Inspiration Ideas
This article is about graphic designing importance and different creative ideas. When we read your support answer now, these are essential for our business growth nowadays. However, a question arises as to how to implement these ideas and what are the types of graphic designing and infographics. So we will show you creative infographic design inspirations. This complete paragraph talks about this thing. Afterward, we will discuss the different keys and strategies and important types and many more about them.
1. Storytelling Through Data
If your website is about the stories. By incorporating graphics here element into your storytelling you can create a more immersive and memorable experience for your audience. Graphic design helps to establish the tone and mood of your story. The choice of color typography and imagery can evoke specific motions and set the stage for the narrative.
This is an idea of using images words and designs to communicate a narrative message or idea. The graphics you are creating can be shaped into several forms such as it can be an animation for books and novels, any comic graphic, or a webtoon. If we talk about the types of graphic novels there are five types of graphic novels. But 3 is the most commonly used and gets more engagement than the other two. These stories are superhero stories personal narratives and fiction stories.
2. Interactive Infographics
An interactive infographic is a simple infographic that has some element of interactivity such as animation factors triggered by the readers clicking and scrolling. These are a type of marketing where people have to get involved to make things happen. The main thinking behind the interactive infographic story is to convince the reader to click or take an action.
Interactive infographics have become a popular choice to achieve just that. In today’s world, we’re always getting lots of information from different places. As a result, it can be difficult to get and keep their attention. Interactive infographics are a great tool for sharing complicated information in a fun and engaging way where you can participate.
3. Minimalist Design
Most people are today familiar with the concept of minimalist user which involves stripping things down to the most basic form. It can be applied to anything from art and lifestyle to architecture and interior design. This concept is applied in a real-life sector. However, you can use this design in your graphics and give them a new shape and create a unique idea.
It is made by a simple clean line and a monochromatic plate with color used as an accent. Usually combines an open floor plan and lots of light and functional furniture. It pays attention to the form, color, and texture of only a few important parts. This technique is used when it is applied to make an interior beautiful. But you can use these techniques and make a Digital view that will represent how your home actually will look.
4. Illustrative Infographics

Graphic illustration is a type of art that you see on flowers, clothes, book covers, ads, packages, posters, and websites. It helps express visual ideas and convey messages as sell products that teach students and promote brands. In today’s world, where visuals matter more and more, graphic illustration seems crucial for our daily lives, even though it can be tricky to pin down exactly what it is.
A simple illustration is an image used to communicate, educate, and decorate. For 10 of thousands of years, humans have used illustration to tell stories, and ideas, and promote specific messages.
Graphic illustrator artists are known for their creativity and ability to create visually interesting images by hand or with the help of a digital pen and pointer to become graphic illustrator artists. Graphic illustrators share a lot of similarities with graphic designers and other carriers in visual communication. However, the field has its own methods goals creative priorities, and rich history.
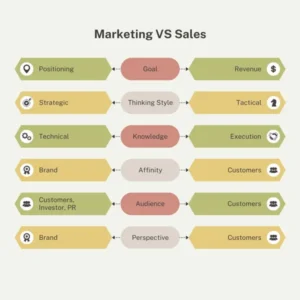
5. Infographics for Product Comparison

In the real world, we see many types of infographics, some of them shoes to compare different products and services offered by different mentors and companies. A comparison infographic is like a picture that uses charts, graphs, or other designs to show how things are alike and different between two or more products or services.
It presents information in a concise and easily Digital format making it a useful tool for making informed decisions or understanding complex data quickly. Sometimes companies use this type of infographic to show the priority of their products to others. This is a great idea for persons who are new in this field because this is easy to make and very useful and gets engagement.
Product comparison is a process of evaluating and contrasting 2 similar products to time to determine their features specifications and performance. Product comparison can help consumers compare the product and make informative purchasing decisions by highlighting the strengths and weaknesses.
6. Timeline Infographics
A timeline infographic is a type of graphic that will display information in the time progression context. This idea is to highlight pieces of information by associating them with periods but addressing the data to be illustrated in detail. Timeline graphics are widely liked, especially in presentations. It’s used often because it’s really adaptable and can be used in many different ways. It can illustrate anytime progression and later information provided it is developed with quality.
A timeline infographic is a common tool in marketing, mainly used to show plans and outcomes over time. Knowing about these different applications is essential to understand more about them. The processes in a company need to be structured. The timeline infographic is the top choice for showing this, as it lays out all these steps in a clear order over time.
As we are discussing the creative designs of graphics now we almost discussed five here and the same numbers are more. Continue your reading and and share your feedback in the comment section also share this blog with your friends who are students of graphic design.
Let’s continue and see another type which is called data visualization.
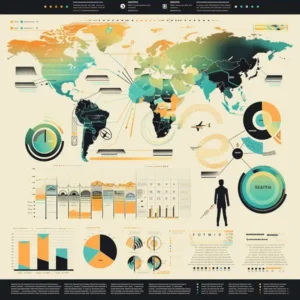
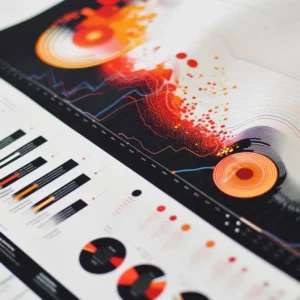
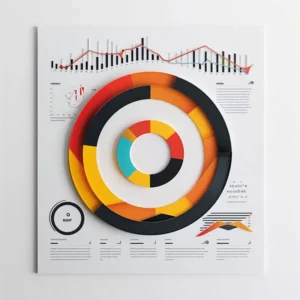
7. Data Visualization
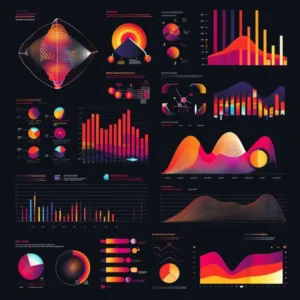
Data visualization means showing information and data using pictures like charts, graphs, and maps. It tools provide and assemble a way to see and understand trends outliers and patterns in data. Moreover, it offers a great method for workers or business owners to share information with people who aren’t familiar with technical details, making sure it’s easy to understand.
Data visualization is important because it makes it easy for people to see and understand data better. Whether simple or complex, the right visualization can bring anyone on the same page regardless of their level of expertise.
Data visualization is like another type of art that catches our attention and makes the message clear. When we see a chart very quickly see trends and outlets. If we can see something we internalize it’s quicker, it’s storytelling with a purpose. If you have ever started at a massive spreadsheet of data and couldn’t see a trend you know how much more effective visualization can be.
8. Infographics for Social Media
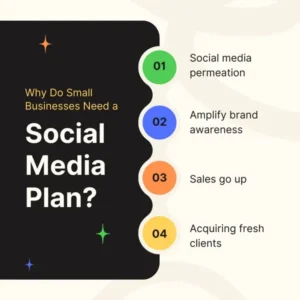
It’s the 21st century, Now there is nobody who doesn’t know about social media. A few years ago this was only used for entertainment purposes but now these tools are not a substantial part of business growth. As we know about social media, we also know social media always provides leads on visual content instead of written content. That’s because social media and graphics have users by providing the information in an easy-to-understand format.
Social media is a visual representation of information used to convey a message or idea. It’s not just infographics, it’s also useful for conveying large amounts of information in a simple and understandable format. Social media infographics can be used on any platform including but not limited to Facebook, Twitter, and Instagram.
There are more than 50 ways to represent your content visually on social media. You can make a short video, a poster, a flyer, or create another different type of post by using some simple graphic design techniques. This colorful way of showing data helps share information quickly, especially on social media.
9. Infographic Poster Designs
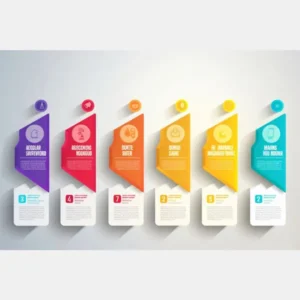
An infographic poster is visual data representing information from a different perspective through engaging visual element type icons graphs charts and stylish fonts. The infographic poster is to make information more interesting and to present complex data in a clear and straightforward way. These posters are common nowadays.
When you want to raise awareness about any harsh issue you can design a poster about it and and present it on your websites and social media accounts. The visual nature of infographic posters helps overcome the challenge of explaining a new complex idea to non-technical persons. It’s not the end, you also can create an inspiring content in a poster. You can make do and don’t posters, for explaining the services that you are providing and explaining anything to students about any specific issue.
The main thing in creating another poster is maintaining your hierarchy and using a simple permanent font style. If you change your four-star wide by word or line by line it can damage the overall look of your poster. Also, use spaces between your designs and content. Use only matching or engaging graphic designs and pictures. Never use any irrelevant photo and do not add too much content make only to the point content in it.
10. Comparison Infographics
A comparison infographic is a picture that helps you see and understand the differences between various choices. By presenting two or more alternatives side by side, this type of infographic helps readers understand the differences between different concepts and, in many cases, which option is best for them.
In marketing, comparison infographics are use to show how your product or service has an edge over your competitors. They usually use a chart or table format, with icons or illustrations to help readers see similarities and differences. This type of infographic is especially powerful when placed in a blog post.
If you’re writing content that compares and contrasts different options, use this type of infographic to complement your analysis. By highlighting your main points, it will make your article easier to scan and help readers make an informed decision about their approach.
These are the few types of infographics that are commonly use and you can apply them to make your content more attractive. Infographics get popularity after the adoption of social media. If we look with the eyes of a marketer, Facebook is use for written content but its child platform Instagram demands only visual content. Other social platforms such as LinkedIn and YouTube are also platforms of visual content.
Explore key Infographic Design Inspiration
We were discussing about creative infographic designs to make your brand unique. So, it’s time to explore the things that are essential to make the designs unique. Today, people are inundated with information, much of which is invisible or only goes in one ear and out the other. Not surprisingly, many brands strive to create their images to bring their messages to life and capture the attention of customers and prospects.
One way to do this is through infographics. By combining engaging visuals and text, infographics make complex information and data more digestible and shareable. But the main thing is to add specialty and uniqueness to your brand identity design. So, always make your product unique and better to achieve good results.
Recommend tools and Resources
Nowadays, many tools are helpful in creating attractive and appealing infographics. Some of them are as follows;
Metrics for evaluating the effectiveness of infographics
There are several factors that you can consider while finding out the effectiveness of your infographics.
For example:
- Views that you are getting on your post and how many engagements it is bringing for you.
- The number of impressions you are getting on your page. As, how many people have seen your infographics?
- Moreover, the number of leads, their quality, and customer conversion rate are some of the factors that you can consider to check the effectiveness of your infographics.
Conclusion
No wonder, now you must have learned a lot about different unique ideas to design infographics. So try and make unique engaging infographics by yourself or if you want to get further assistance for your infographic designs you can take our Graphic Designing Services and get expert opinions from infographic creators at We Art Friends. You can simply call us at this number +1 917 267 8961 or send an email to info@weartfriends.com.